

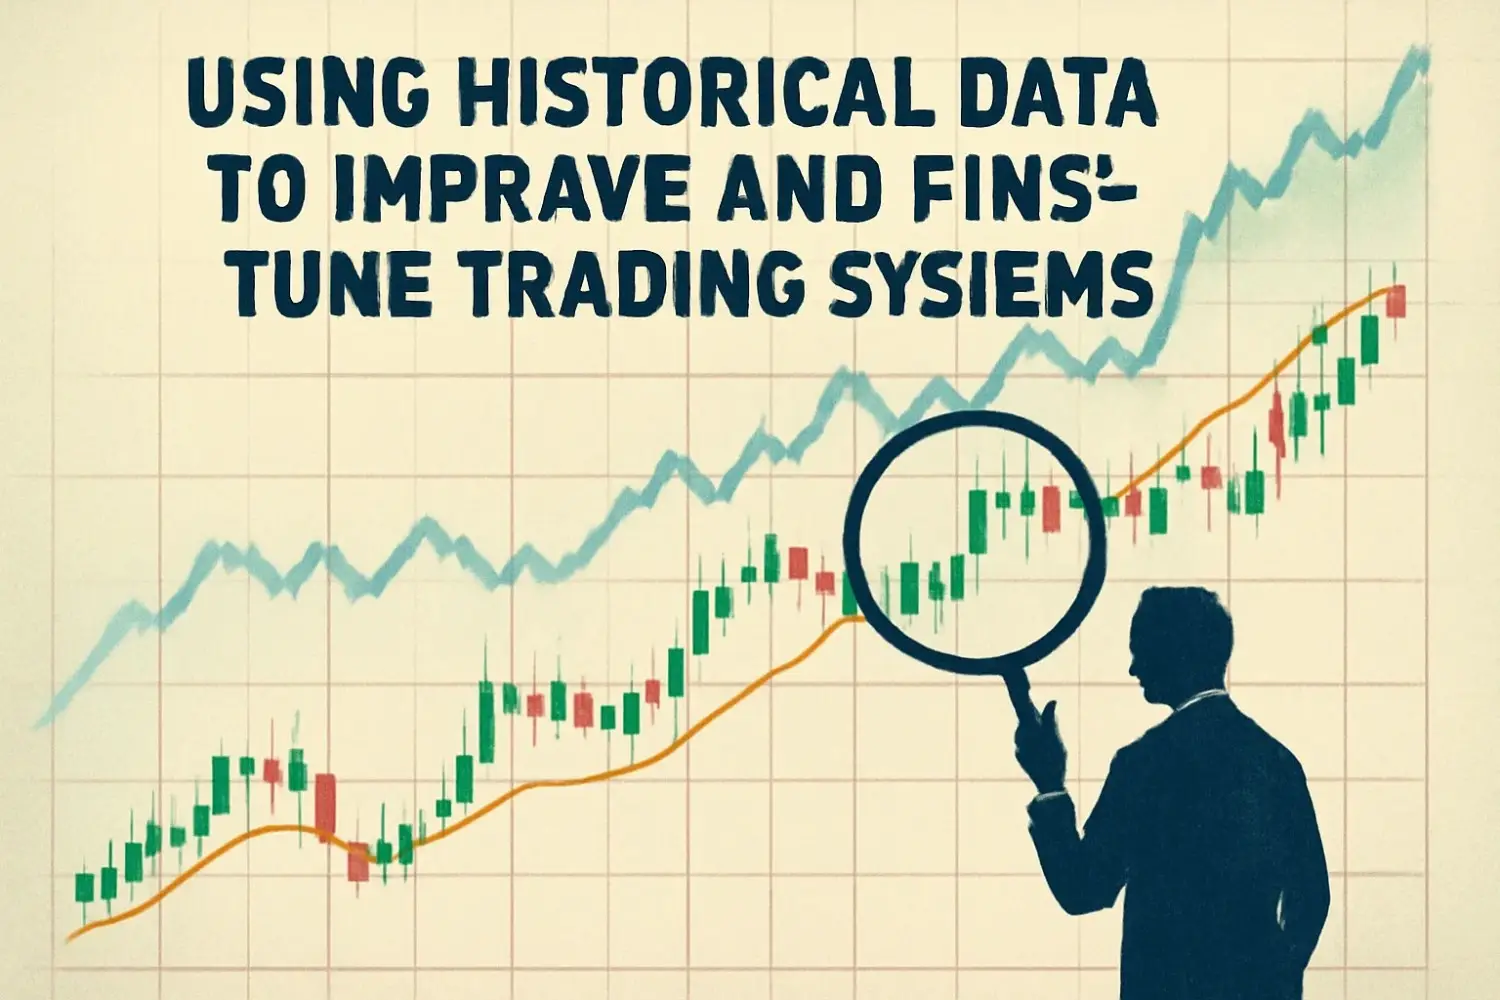
Introduction: The Value of Historical Data in Trading System Optimization
In the world of trading, data is king. Successful traders know that to build and refine a profitable trading strategy, they must rely on historical data. This data, when used properly, allows traders to optimize and fine-tune their trading systems, providing a deeper understanding of how a strategy behaves in different market conditions.
Using historical data effectively can help you spot patterns, assess risk, and improve your decision-making process. In this article, we’ll explore how historical data can be used to improve and fine-tune your trading system to enhance performance, increase profitability, and ensure long-term success.
Why Historical Data Is Crucial for Trading System Optimization
Historical data is essentially the backbone of any optimization process in trading. Here’s why it is so vital:
1. Evaluating System Performance
Historical data allows traders to evaluate how well their trading system would have performed under past market conditions. This includes testing systems on various asset classes, timeframes, and volatility levels to understand how it would have fared in different environments.
2. Understanding Market Behavior
By analyzing past market movements, traders can identify patterns and trends that provide valuable insights into future market behavior. Understanding historical market patterns can help traders create more robust systems that adapt to changing conditions.
3. Reducing Risk
Backtesting a system on historical data helps reduce the risk of unexpected losses. It allows traders to identify weak spots, such as systems that perform well in some conditions but fail under others. By identifying these weaknesses, traders can make necessary adjustments to minimize risk in real-time trading.
How to Use Historical Data for System Optimization
Optimizing a trading system with historical data involves more than simply running a backtest. It requires analyzing patterns, testing different strategies, and making adjustments based on what the data reveals.
1. Start with Backtesting
Backtesting is the foundation of any optimization process. It involves applying your trading strategy to historical market data to see how it would have performed. By running a backtest, you can assess critical performance metrics such as win rate, drawdown, profit factor, and risk-to-reward ratio.
How to Backtest Effectively:
-
Select Relevant Data: Choose a dataset that is relevant to your strategy. If you trade forex, use historical forex data for backtesting. If you focus on stocks, use stock market data.
-
Choose the Right Timeframe: Ensure you backtest on the same timeframe your system is designed for. For instance, if you’re using a 5-minute strategy, ensure the historical data reflects that timeframe.
-
Use Clean Data: Ensure the data is accurate and free of errors. Low-quality data can lead to misleading results and poor system performance.
-
Account for Slippage and Fees: Include transaction costs, slippage, and spreads in your backtesting process. These factors are critical for assessing real-world profitability.
2. Experiment with Different Parameters
Once your backtest is set up, the next step is to optimize the parameters. Trading systems often have multiple settings that influence their performance, including indicator periods, stop-loss levels, and take-profit targets.
Optimizing Parameters:
-
Adjust Indicator Settings: Test various values for indicators like moving averages, RSI, and MACD. Find the values that offer the best balance between profitability and risk.
-
Optimize Stop-Loss and Take-Profit Levels: Experiment with different stop-loss and take-profit levels to identify the ideal risk-reward ratio for your strategy.
-
Test Different Market Conditions: Run the backtest over different market conditions (e.g., trending, range-bound, or volatile markets) to evaluate how well your strategy adapts to various scenarios.
3. Use Walk-Forward Testing
Walk-forward testing is an advanced method used to validate a system’s robustness by combining backtesting with real-time data. This technique helps ensure that a strategy is not overfitted to historical data and can perform well in future, unseen conditions.
How Walk-Forward Testing Works:
-
Divide the data into rolling periods (e.g., 6-month segments).
-
Optimize the system using data from the first period.
-
Test the system on the next segment of data (out-of-sample data).
-
Repeat the process by sliding the optimization period forward and testing on the next segment.
-
Assess performance: Analyze the results of each walk-forward segment to check if the system is consistently profitable.
Walk-forward testing ensures that your system is optimized in a way that will adapt to changing market conditions without being too tailored to past data.
4. Identify Patterns and Market Conditions
Historical data isn’t just for backtesting and optimization—it’s also an invaluable tool for identifying patterns and market conditions that influence your strategy’s success.
Analyzing Market Patterns:
-
Trend Reversals: Use historical data to identify recurring patterns like trend reversals, breakouts, and support/resistance bounces.
-
Volatility Patterns: Assess how your system performs during periods of high volatility. Adjust your system to manage risk effectively during volatile market conditions.
-
Seasonality: Some markets exhibit seasonal patterns (e.g., certain commodities perform better at specific times of the year). Historical data can help identify these patterns and optimize your strategy accordingly.
5. Risk Management Adjustments Based on Historical Data
Risk management is one of the most important aspects of a trading system. Using historical data, you can fine-tune your risk parameters to ensure that your system is both profitable and sustainable.
Optimizing Risk Management:
-
Stop-Loss Optimization: Test different stop-loss levels to find the most optimal placement based on historical volatility and price action.
-
Position Sizing: Experiment with different position sizing techniques, such as fixed fractional or fixed ratio, based on historical data to ensure that your system doesn’t overexpose your account.
-
Drawdown Control: Use historical data to evaluate your system’s drawdowns. Identify periods where your system has experienced significant losses and optimize it to minimize future drawdowns.
6. Monitor and Adjust Based on Real-Time Data
While historical data is crucial for system optimization, it’s also important to monitor the system’s performance in real-time and adjust when necessary. Markets evolve, and the optimal settings that worked in the past may not continue to work in the future.
How to Monitor and Adjust:
-
Track Performance Regularly: Even after backtesting and optimization, regularly review your system’s performance. Compare your backtest results to live or demo performance and make adjustments as needed.
-
Adapt to Market Conditions: Be prepared to adjust your system’s parameters as market conditions change. For example, during high volatility, you may want to widen your stop-loss or adjust your risk management settings.
Conclusion: Using Historical Data for Long-Term Success
Historical data is a powerful tool for improving and fine-tuning your trading system. By backtesting your system, optimizing parameters, and using walk-forward testing, you can ensure that your strategy is robust, adaptable, and profitable over time.
Using historical data allows you to:
-
Identify optimal entry and exit points
-
Analyze market patterns and adapt to changing conditions
-
Fine-tune risk management to protect your capital and maximize profits
-
Monitor system performance to make ongoing adjustments
By combining historical data analysis with real-time testing, you’ll build a more reliable trading system capable of navigating different market environments with confidence. Proper use of historical data ensures that your strategy is optimized for success, increasing your chances of long-term profitability.